Launched at the start of London Climate Week, two new analytical tools provide organisations across England with robust evidence to pinpoint where environmental pressures overlap with socio-economic and health challenges.
Emeritus Professor Jon Fairburn (University of Staffordshire) and Prof Gordon Mitchell (University of Leeds) are the academic experts involved in the development of the tools. Professor Jon Fairburn and Professor Gordon Mitchell said:
“By bringing together rich spatial data into a single, evidence-driven index, IMED reveals the true cumulative burden of environmental deprivation – informing citizens and empowering decision-makers to target interventions where they are needed most. This index gives local authorities a clearer, place-based understanding of how environmental pressures -from air quality to heat stress – combine across neighbourhoods, supporting targeted action and better outcomes for communities most in need.”
John Leyland, Executive Director of Environment and Business at the Environment Agency said:
“Protecting communities from environmental pressures is central to our work at the Environment Agency, but we know that some communities face greater pressures than others.
“That’s why we have developed these tools which provide for the first time a clear picture of environmental pressures across England – so that we can direct our resources where they’re needed most by the communities we serve.”
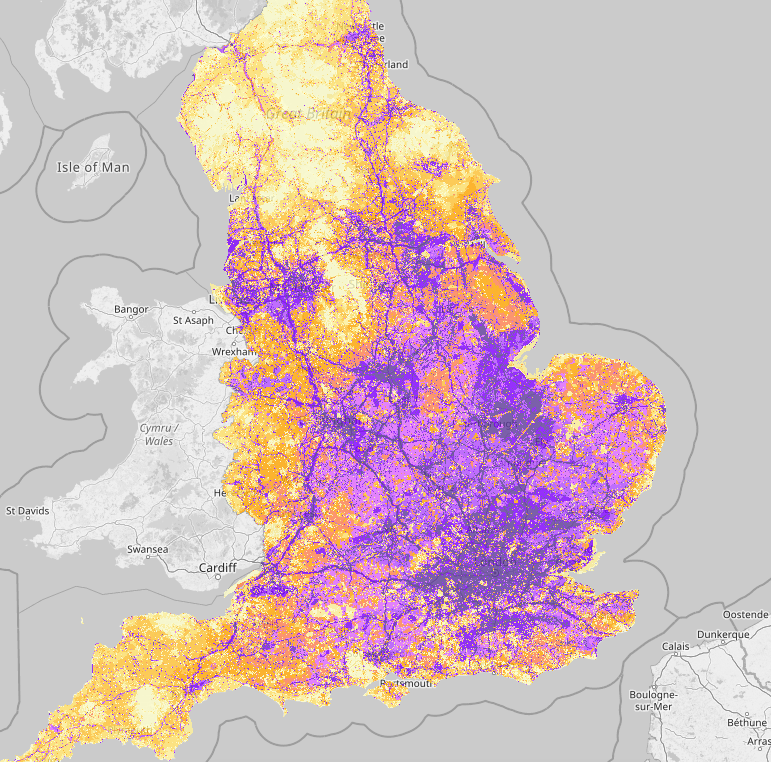
Figure 1 – All of England is available at at street-level resolution and other local geographies including Lower Super Output Areas (LSOAs)
What the tools are and why they matter
At a high level, the Index of Multiple Environmental Deprivation (IMED) focuses on mapping cumulative environmental pressures at a national scale, while the Environmental Equity Index (EEI) brings environmental data together with social and health indicators to highlight cumulative equity challenges, particularly in urban areas.
David Drake, Director for People and Nature at Natural England said:
“Natural England’s expertise in green infrastructure, spatial data and nature-based solutions shaped how these tools were designed and what they measure.
“Decision-makers now have something they haven’t had before: a consistent, high-resolution evidence base covering the whole of England that can tell us, at a glance, where environmental disadvantage is greatest so that we can take action.”
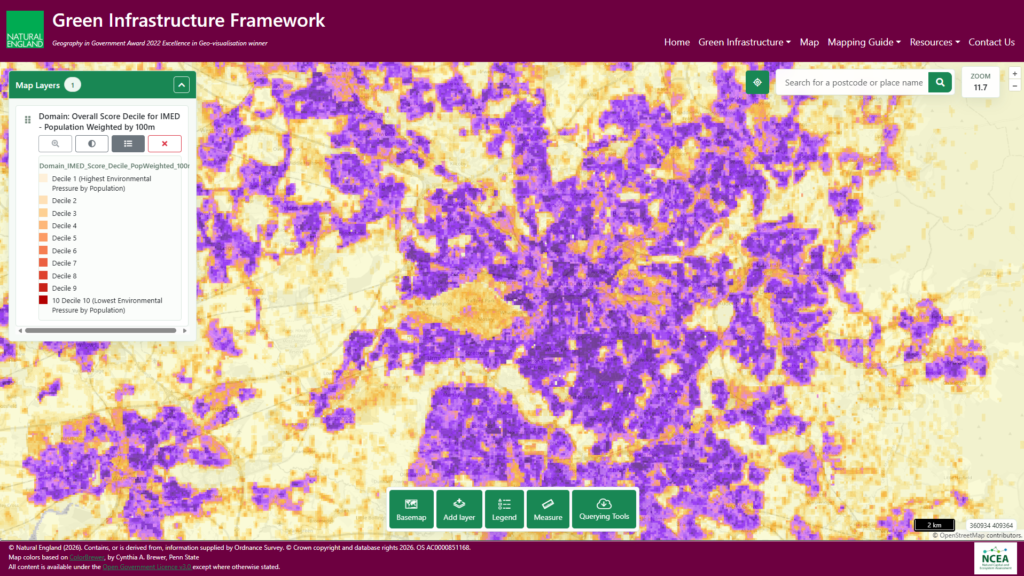
Figure 2 – Zooming in on the Manchester area
Environmental conditions such as air quality, access to green space, noise, flood risk and climate pressures have a significant influence on health, wellbeing and life chances. These pressures are often unevenly distributed and can coincide with existing social and health vulnerabilities. IMED and EEI help make these cumulative pressures visible, supporting fairer prioritisation and more effective action, and supporting delivery of key national priorities including the Environmental Improvement Plan, Local Nature Recovery Strategies, Biodiversity Net Gain, and the Growth and Health Missions.
Figure 3 – Zooming in on London
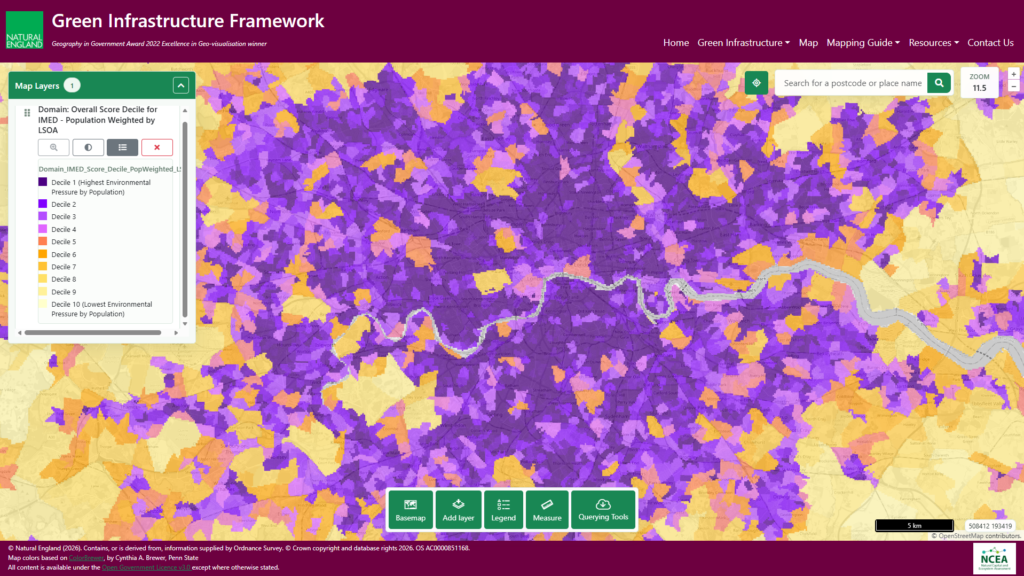
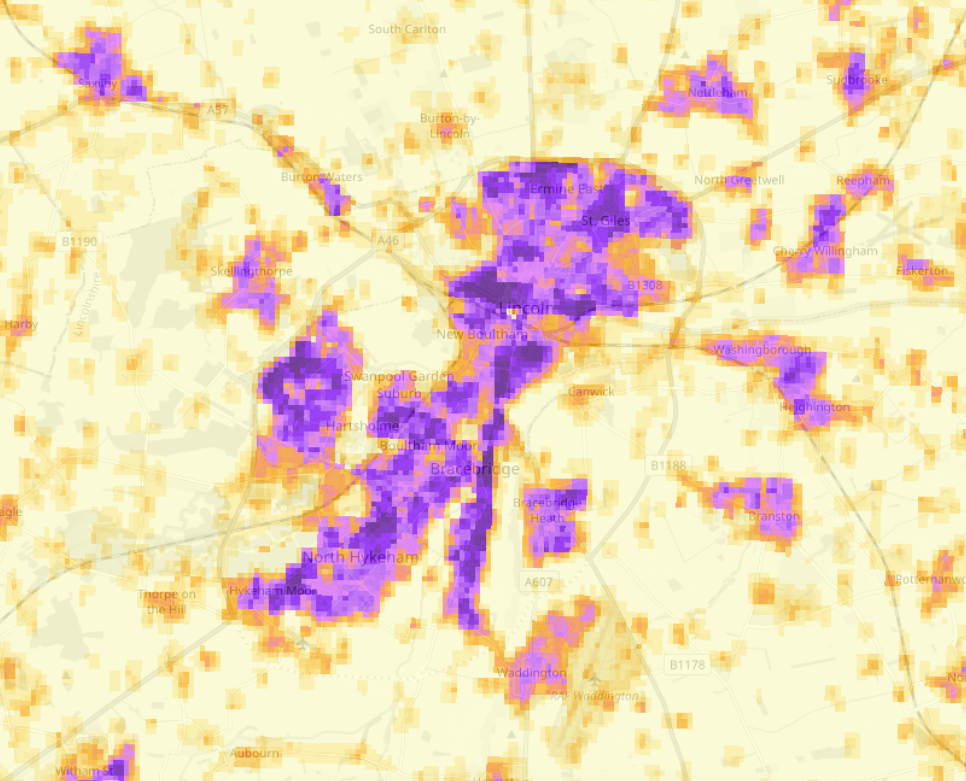
Figure 4 – Zooming in on Lincolnshire
How the tools were developed
IMED and EEI were developed collaboratively with contributions from the Environment Agency, Natural England, Friends of the Earth, the Environmental Data Network, deprivation.org and the University of Staffordshire and the University of Leeds. The tools have been piloted with local authorities, NGOs, health bodies, planning organisations and government departments to ensure they are practical, relevant and usable in real‑world decision‑making.
Mike Childs, Head of Science, Policy and Research at Friends of the Earth said:
“We’ve known for a long time that some communities are disproportionately affected by environmental harm and exposed on multiple fronts. So today’s launch, which sees these compounding threats tracked officially for the first time, is a significant step towards improving access to information and justice on the environment.
“With these tools, communities and councils can gain a clear understanding of the main environmental risks locally, as well as which areas need to be prioritised for action. We know just how valuable resources like these are for delivering change at the local level thanks to our work with hundreds of local action groups up and down the country. This is a shining example of what collaboration between government, campaign groups and academia can unlock.”
What IMED and EEI are
- IMED provides national coverage, combining multiple environmental indicators into a single score at 100m² resolution (with aggregation options).
- EEI integrates environmental (IMED), social and health indicators, also at 100m² resolution, with a particular focus on urban areas and cumulative equity challenges.
Used together, the tools are designed to be complementary, supporting analysis at both national and local scales.
How IMED and EEI can be used
IMED and EEI support a range of strategic, analytical and operational uses, including:
- Strategic screening and comparison across places using a common evidence base
- Identifying cumulative environmental pressures, including potential “triple jeopardy” areas
- Prioritising locations for further investigation, intervention or engagement
- Strengthening planning and policy evidence, including climate resilience and nature recovery
- Informing regulation and public health analysis
- Supporting joined‑up working across environment, health and planning, including engagement with communities
The tools are intended as decision‑support, to be used alongside local knowledge and professional judgement, rather than as standalone determinants
Where the tools can be accessed
IMED and EEI are available through Natural England’s Green Infrastructure (GI) Mapping Tool, providing an accessible, interactive platform to explore and visualise the data alongside other relevant GI layers.
Access the tools here: Green Infrastructure Map
A launch webinar and a technical webinar in the autumn will provide further detail on the methodology, data, and practical application. Additional engagement activities and events will also be developed as part of the wider rollout.
The tools are evolving, and feedback is sought to help improve their use, functionality and supporting guidance. We encourage you to engage with the tools and share your insights!”
Contacts and more information
Joe Swift, Public Health Team, Environment Agency
joe.swift@environment-agency.gov.uk
Resources
Prof Jon Fairburn – research repository, Google Scholar profile, Linkedin
Prof Gordon Mitchell – research repository, Google scholar profile, Linkedin